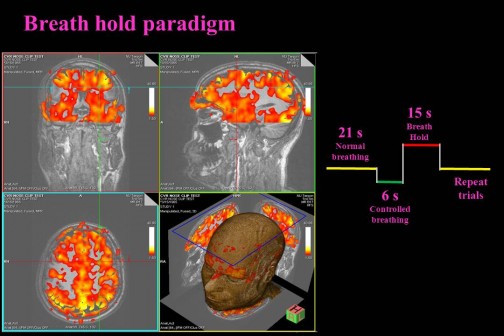
The cerebrovascular response (CVR) results in increased blood flow due to the increased CO2 during the breath hold. These BOLD signal change maps represent changes in gray matter.
Normal CVR
CVR is a quantitative measure of the cerebrovascular response to a challenge. Typically the challenge is breathing CO2 enriched air or being administered Acetazolamide, which causes an increase in the cerebral blood flow (CBF). We have implemented a method of breath holding to act as the vascular challenge. These short 15 second breath holds are done while collecting high resolution BOLD sensitive data. Averaging 6 trials of breath holding allows us to generate a map of the CVR in 5 minutes (See figure to the right) . We are using this to investigate the alterations of the cerebrovasculature in stroke subjects, Alzheimer’s disease patients, tumor patients, AVM patients, and subjects enrolled in therapy trials.

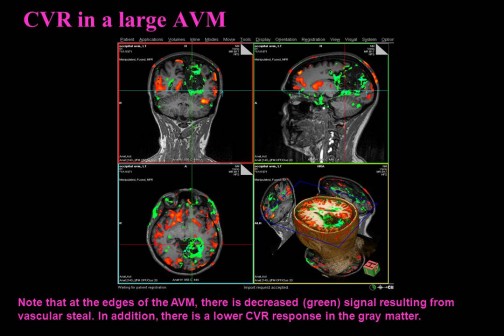
CVR map in a patient with a large occipital AVM. Note the decreased response in the gray matter in the hemisphere with the AVM. The impact of the AVM is the vascular steal in the surrounding tissue shown as green. In this case, the BOLD signal is decreased during the breath hold, which is opposite of the normal tissue.
Abnormal CVR
The figure to the right shows the CVR map in a patient with a large Arteriovenous Malformation (AVM). The presence of the AVM alters the cerebrovasculature and it is possible to use the CVR map to show the impact of a large occipital AVM. In this example, the perilesional region is highlighted in green because the BOLD signal actually decreases during the breath hold instead of increasing. This is known as vascular steal and indicates that the AVM is putting these tissues at risk. Understanding the CVR will allow us to better detect physiologic changes which may indicate response to therapy or treatment. Additionally, the CVR can be used to normalize subject’s BOLD data in longitudinal or multi-center trials, which is important for improving results.
