The signal detected in functional magnetic resonance imaging (fMRI) is on the order of a one percent (often less!) from the baseline signal. Time series data with a high static and temporal signal-to-noise ratio (SNR) is required to reliably detect these changes. This project developed a model to determine the minimum required signal-to-noise ratio necessary for detecting the expected BOLD signal change.
The immediate benefits are clinical, addressing the neurosurgeon’s need to know if a region of brain near a lesion is active. Knowing the temporal signal-to-noise characteristics allows one to make a more informed decision about the derived functional maps, which is of use to neuroscientists as well. The result is a blood oxygen level dependent (BOLD) sensitivity map that depicts the minimum BOLD signal change that can be detected given the experimental parameters and statistical requirements.(Read TSNR Paper)
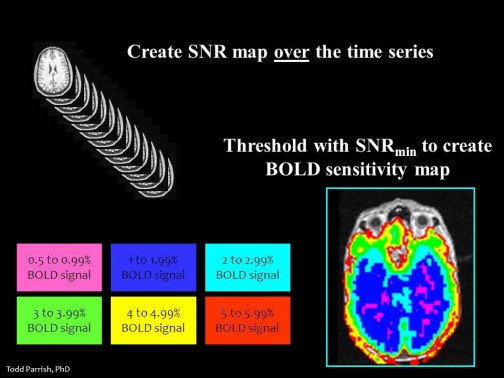
A time series is represented by a stack of brain slices taken every 2 seconds (upper left of figure to the right); the temporal signal to noise can be calculated and color coded based on the minimum detectable BOLD signal change, aka a BOLD sensitivity map (lower right).
Notice that in the region near the sinus, a larger signal change is required. In this brain tissue, the BOLD signal changes may not meet this requirement. The implication is that these regions cannot be investigated with the stringent statistical threshold. The temporal signal to noise can also be used to explore the benefits of smoothing fMRI data.
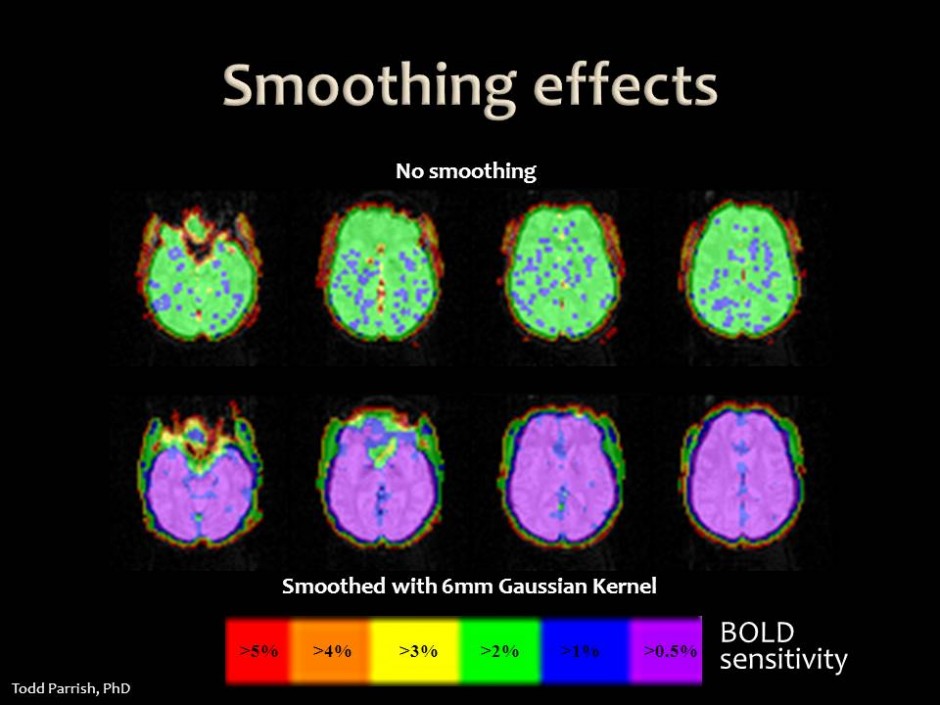
In Figure 2, the BOLD sensitivity maps show the effect of spatial smoothing, the top row represents no smoothing and the bottom row depicts the improved tSNR after a 6mm (2 pixel) Gaussian smoothing kernel has been applied. the improvement is depicted by the increase sensitivity to the BOLD signal change (green becoming purple, 2% down to 0.5% detection)

Fig. 2 The benefit of smoothing to improve the detection of BOLD signal changes
More and more studies are involving multiple sites to collect larger diverse populations for functional imaging studies.
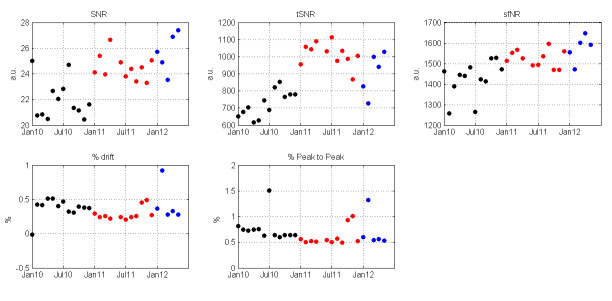
Specifically aimed at a disease (Alzheimer’s or Parkinson’s) or comparing cultural differences, it is critical to understand the differences from site to site. Use of temporal signal noise measures allows investigators to identify suspect data or sites. Our group has been using this measure in a number of studies to promote uniform data collection or detect hardware or environmental issues affect the scanning data. (See QA Plot Figure for a sample dataset)


